The coverage ratio is an indicator of the financial position of a pension fund. If the coverage ratio is 100%, the pension fund has exactly the same amount of money as the total pensions to be paid out.
The policy coverage ratio is an average of the coverage ratios from the previous 12 months.
If you have any questions about the financial position of the pension fund, please see frequently asked questions about the financial position.
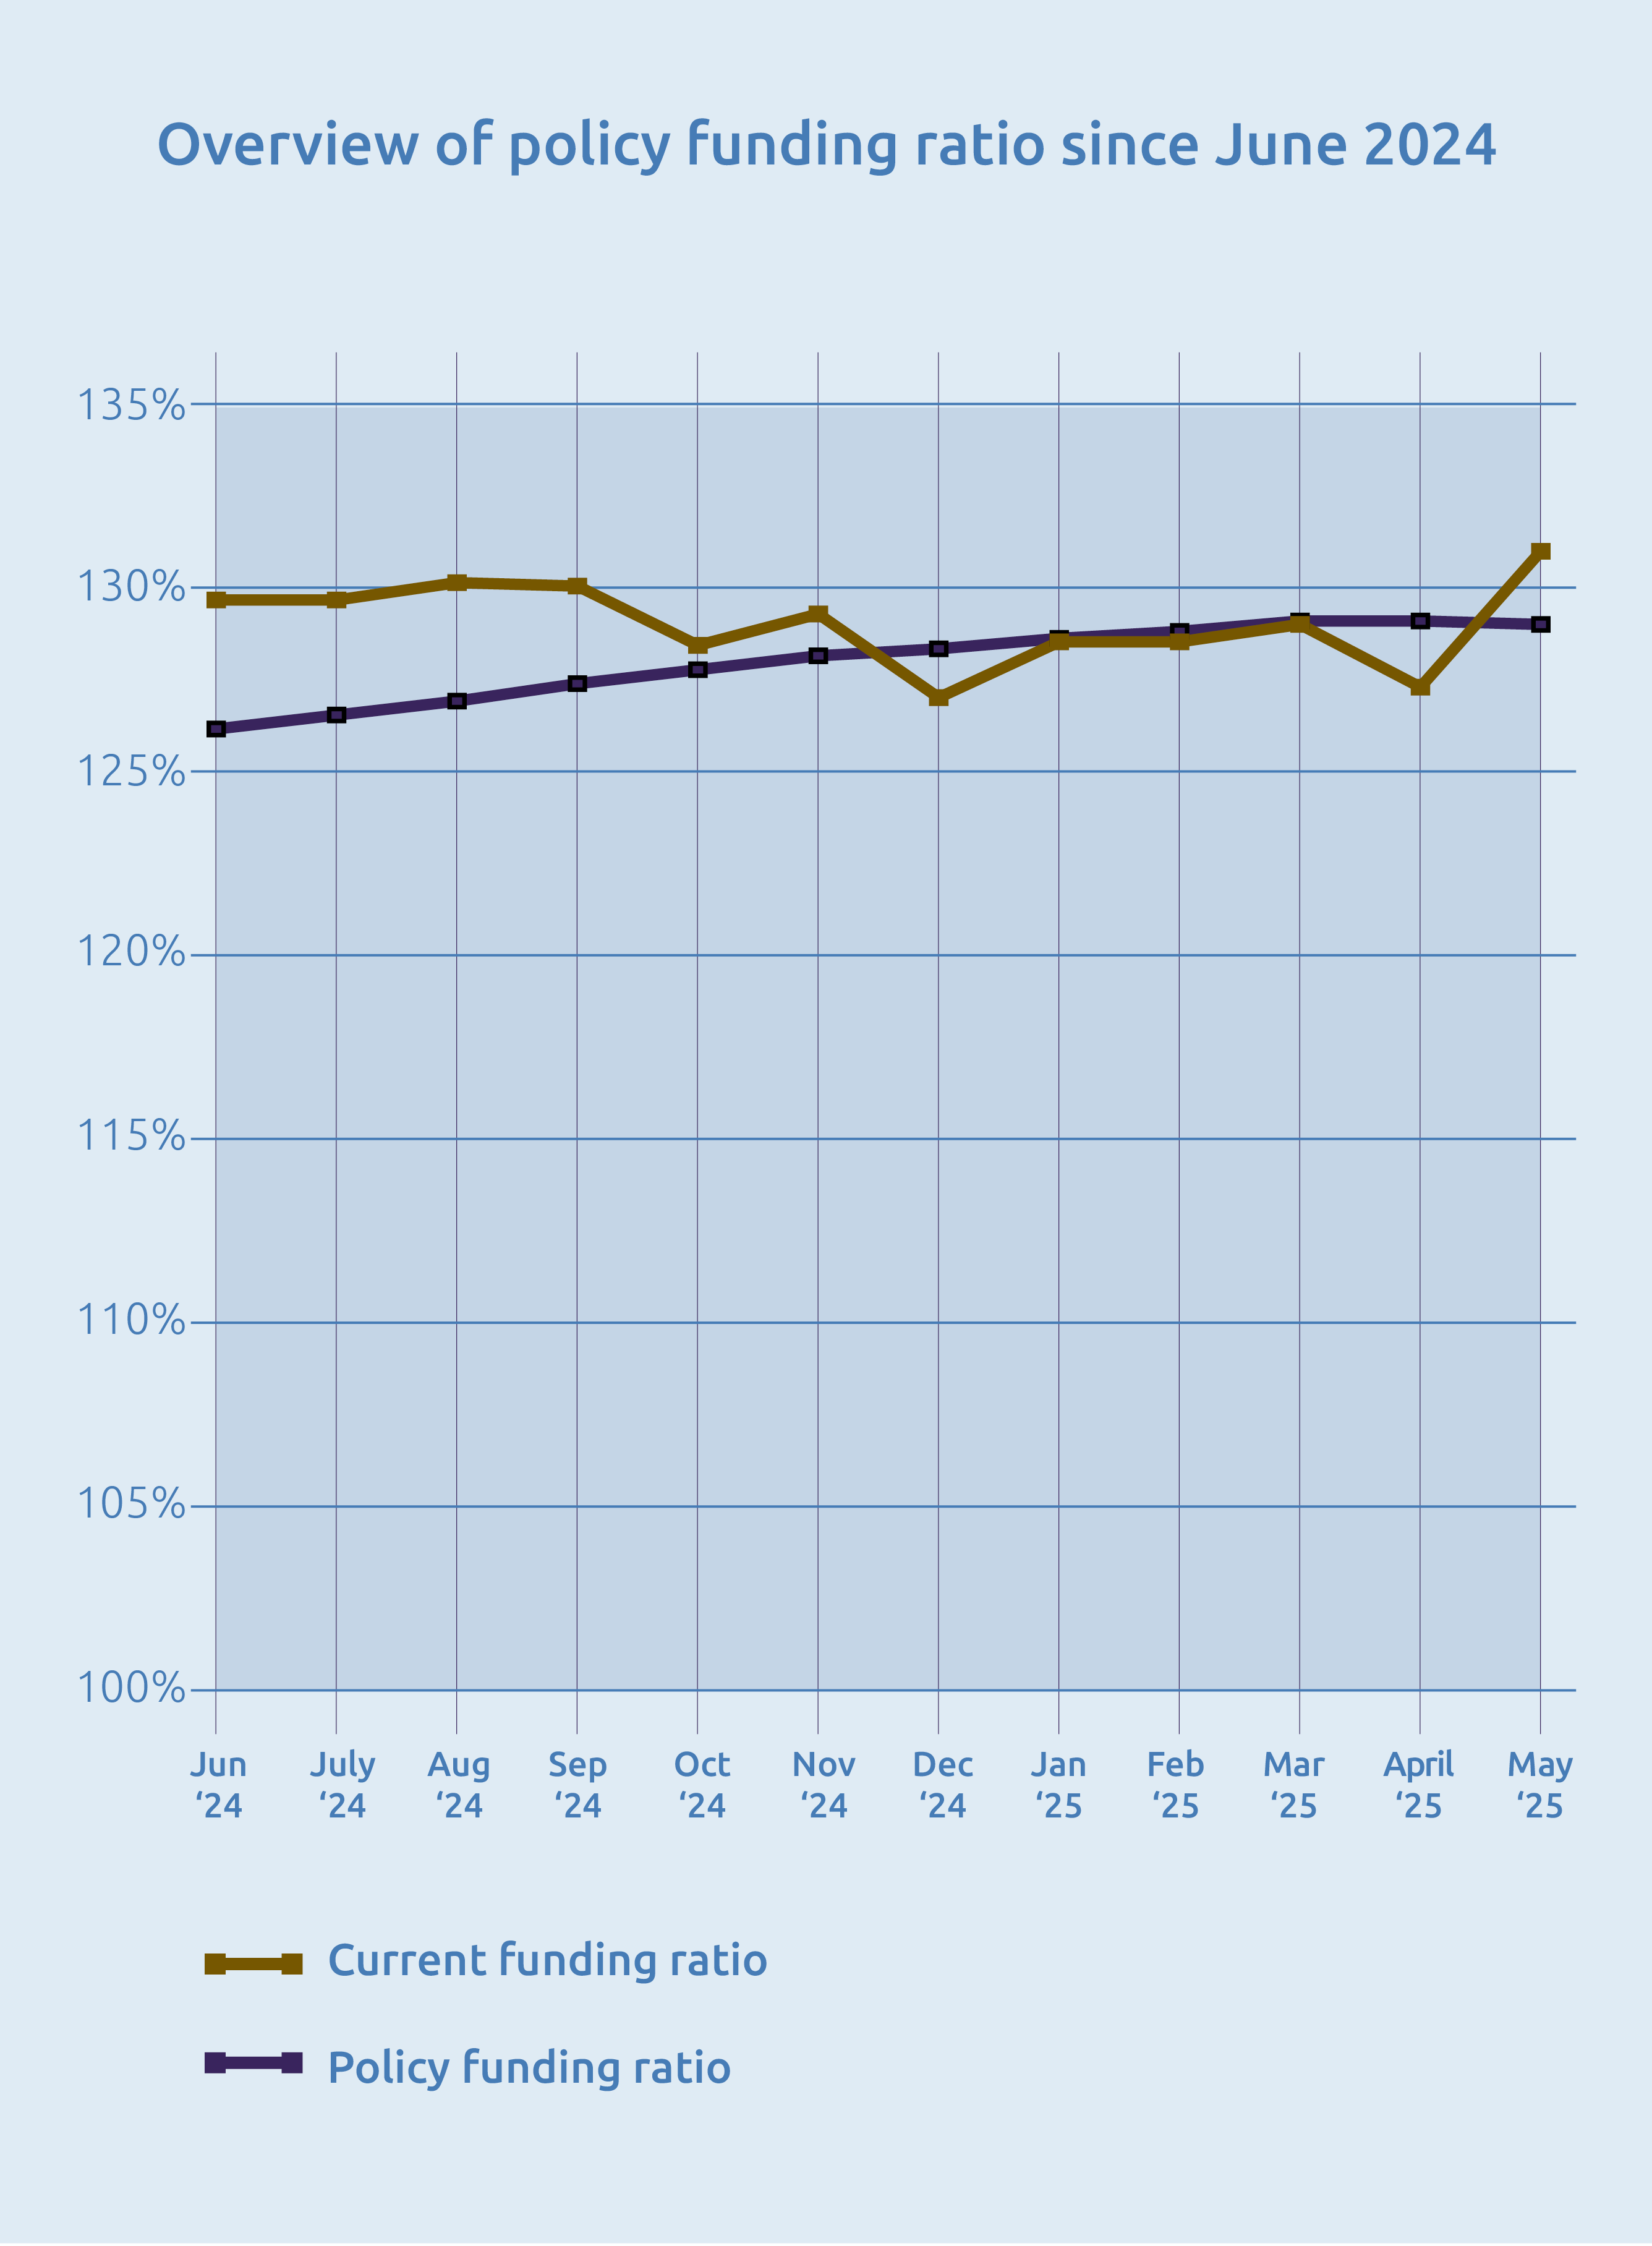
Development of the funding ratio in 2025:
| by | Current (%) | Policy funding ratio (%) |
| 31 May 2025 | 131.1% | 129,0% |
| 30 April 2025 | 127.2% | 129.1% |
| 31 March 2025 | 129.0% | 129.1% |
| 28 February 2025 | 129.5% | 129.0% |
| 31 January 2025 | 129.5% | 128.8% |
Development of the funding ratio in 2024:
| by | Current (%) | Policy funding ratio (%) |
| 31 December 2024 | 128.0% | 128.4% |
| 30 November 2024 | 129.3% | 128.1% |
| 31 October 2024 | 128.4% | 127.7% |
| 30 September 2024 | 130.1% | 127.3% |
| 31 August 2024 | 130.2% | 126.8% |
| 31 July 2024 | 129.5% | 126.4% |
| 30 June 2024 | 129.7% | 126.0% |
| 31 May 2024 | 129% | 152.2% |
| 30 April 2024 | 127.2% | 124.8% |
| 31 March 2024 | 127.6% | 124.4% |
| 29 February 2024 | 126.8% | 123.9% |
| 31 January 2024 | 125.3% | 123.5% |
Development of the funding ratio in 2023:
| By | Current (%) | Policy funding ratio (%) |
| 31 December 2023 | 124,5% | 123,1% |
| 30 November 2023 | 124.6% | 122.7% |
| 31 October 2023 | 122.8% | 123.1% |
| 30 September 2023 | 124.6% | 123.7% |
| 30 August 2023 | 124.0 | 125.0 |
| 30 July 2023 | 124.8 | 124.4 |
| 30 juni 2023 | 123,1 | 124,7 |
| 31 May 2023 | 121.9 | 125 |
| 30 April 2023 | 121.8 | 125.6 |
| 31 March 2023 | 121.3 | 126.2 |
| 28 February 2023 | 122.0* | 126.6 |
| 31 January 2023 | 120.2* | 127.0 |
* The Funding ratios were adjusted as a result of the annual work audit.